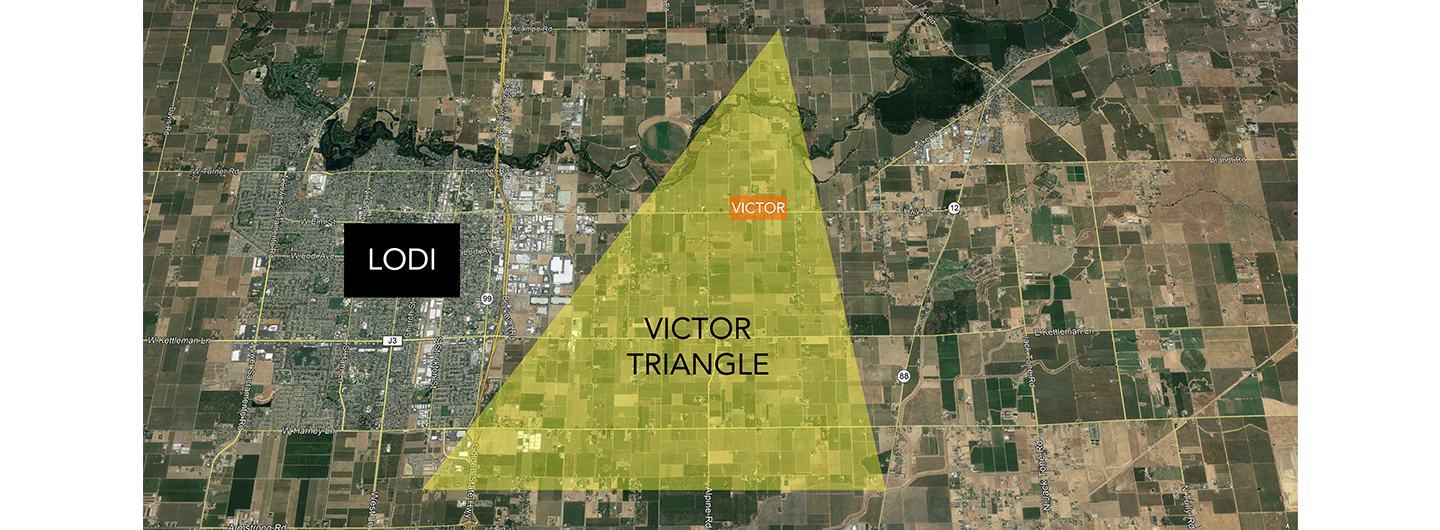
A recap of the key milestones of the 2020 winegrowing season based on data from a weather station near our winery in Victor, California, east of Lodi.
Summary
Overall, 2020 will mostly be remembered for the COVID-19 worldwide pandemic that so tragically touched all of us.
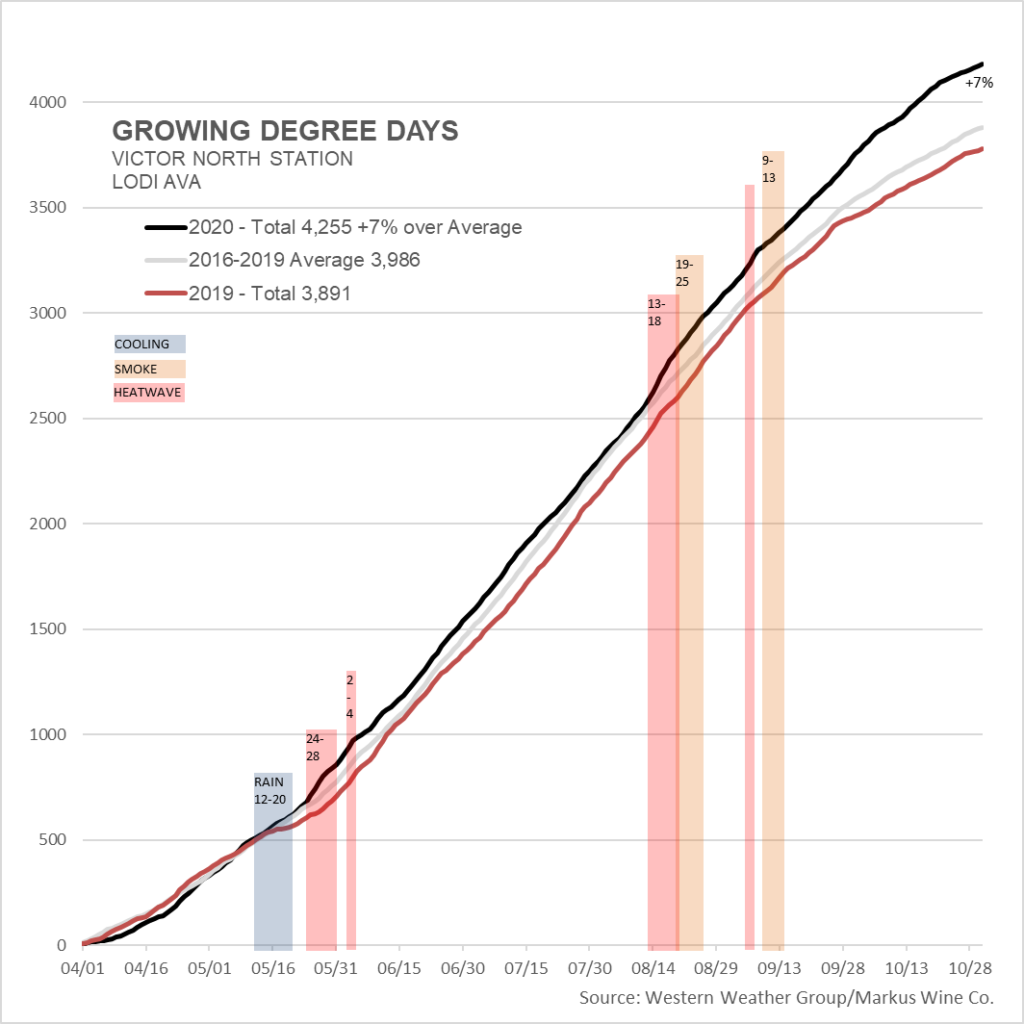
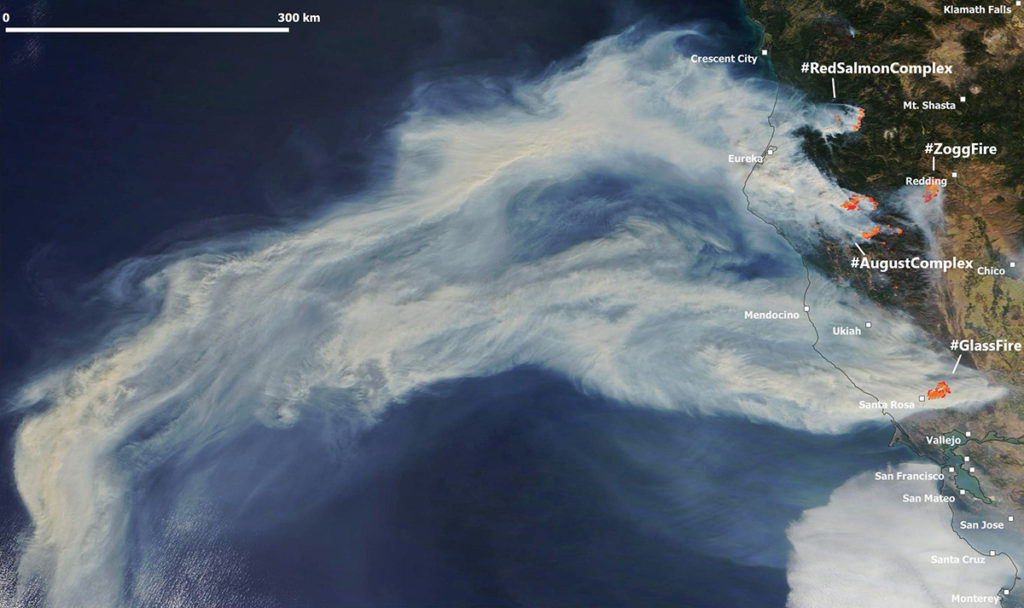
From a grape growing point of view, the year got off to a warm, dry start, leading into a fairly optimal summer. That all changed with the arrival of a record-breaking mid-August heatwave and massive wildfires with widespread smoke that fortunately did not affect the Lodi crop, other than shade us from higher temperatures. The record heat kept the area up to 7% above average for the remainder of harvest, including all red varieties. To handle the heat, most growers were forced to irrigate, leading to generally lower levels of acidity and sugar. As fermentations complete, we will have a better appraisal of the quality of the vintage.
January through April
The most memorable factor this winter is what didn’t happen. Take a look at the chart below, showing the daily rainfall as dark blue columns:
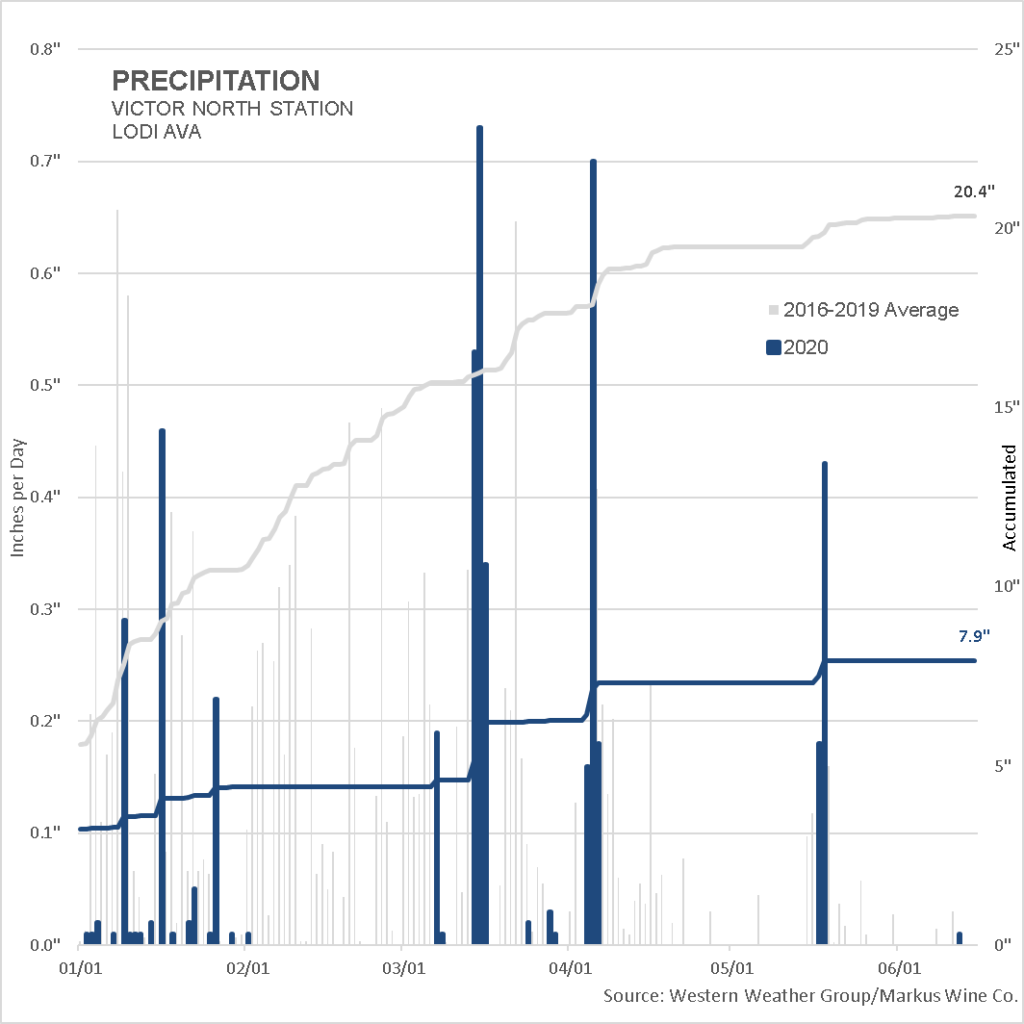
We were already behind on seasonal rainfall accumulation at the end of January, but then after receiving a hundredth of an inch on February 1, there wasn’t a drop of rain through February until March 7 – 33 days of no rain. You can see by the gray bars that we normally average a significant portion of our annual rainfall during February. If it weren’t for good storms in mid-March and early April, we would have been in much worse shape.
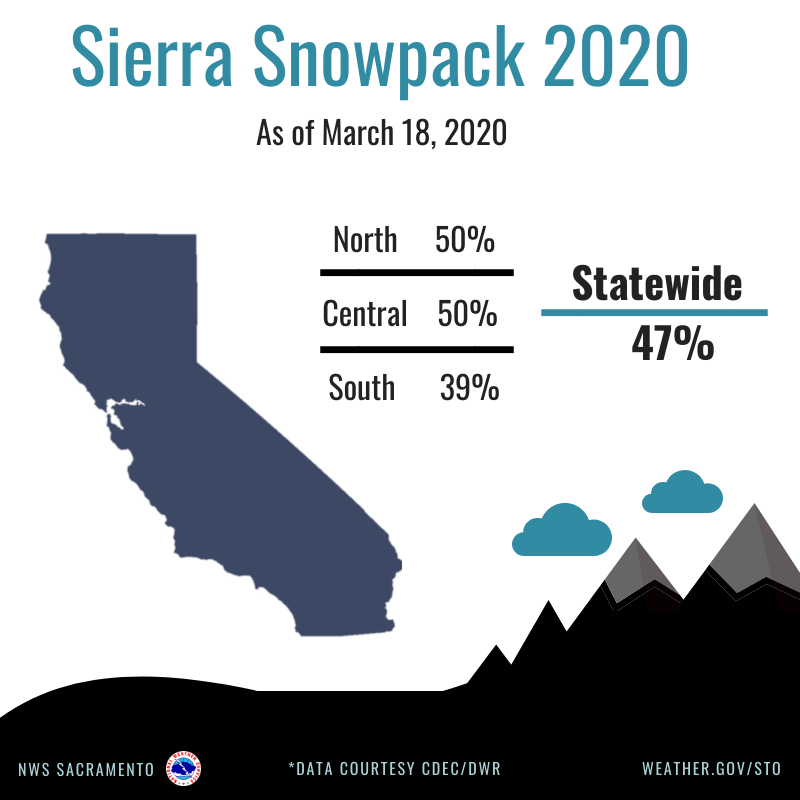
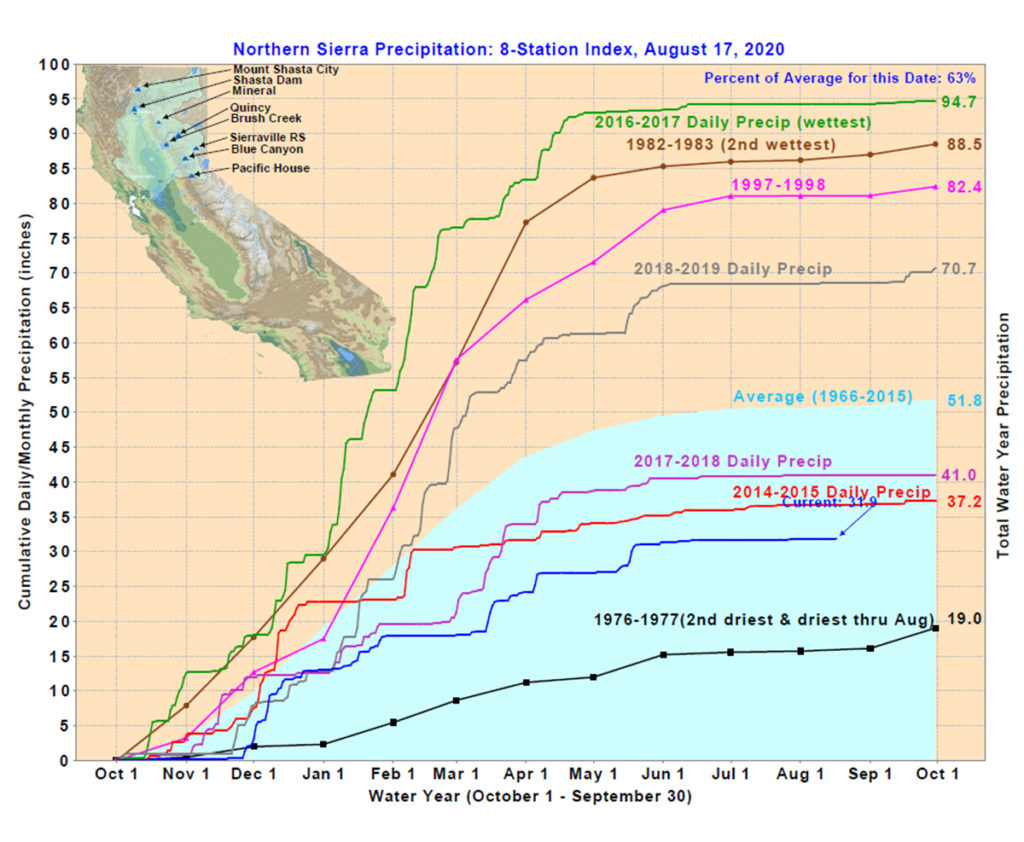
And, predictably, the snowpack was about half of what it normally would be by mid-March:
March is when the majority of bud break occurs. The lack of cloud cover contributed to pre-bud break temperatures that were above normal:
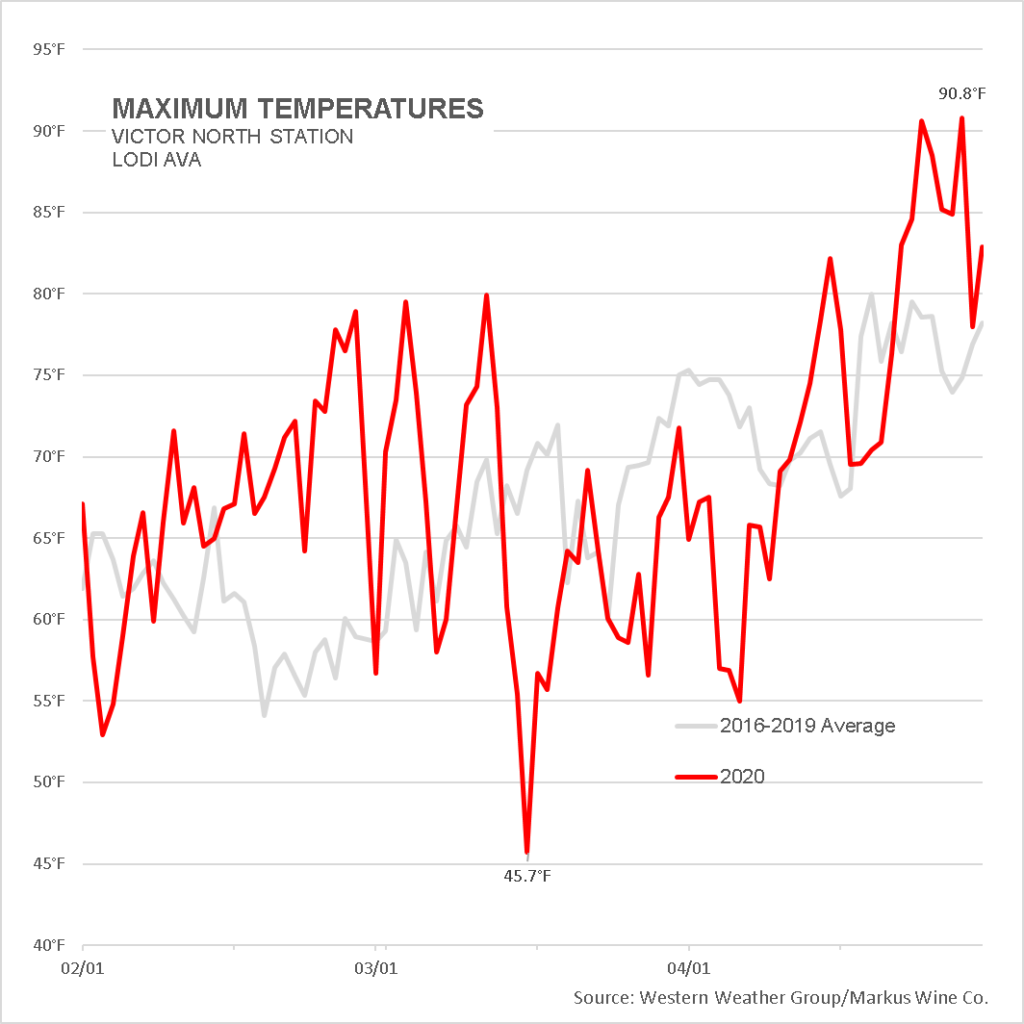
Despite the lack of rain and warmer weather, bud break started pretty much on time.
March is also when we all finally took the COVID-19 pandemic very seriously. On March 15, the Governor of California required the closure of all California winery tasting rooms, bars, nightclubs and brewpubs. Several days later, on March 19, 2020 the Governor further directed California residents to stay at home. By then, our San Joaquin County had only 17 cases of COVID and 2 deaths, much better than the devastating situation affecting New York.
Lodi wineries shifted to taking more phone and website orders than ever before. Wine orders were mostly available for curbside pickup at the tasting rooms, and some winemakers personally delivered orders to customers at home for no charge. Those wineries that sold through distribution to grocery stores saw large increases in sales. Restaurant sales unfortunately dropped nearly to zero as they could only serve food via take-out.
April usually brings damaging frost, but, fortunately, we made it through the month with almost textbook-perfect growing conditions: temperatures up into the upper 70s and mid 80s, with a few days of light rain, and no frost or hail.
May through July
For years, the month of May had been a predictably nice, dry and warm portion of the season, but last year we nearly had snow, and this year we had rain and a heatwave.

During the weekend ZinFest would have taken place, May 17-18, a low-pressure system dropped straight down the west coast delivering a half-inch of rain and cooler weather just as bloom was coming to a close.
Typically, rain can disrupt pollination, causing some flowers to not pollinate and drop off as “misses”, or causing sub-optimal pollination, resulting in small “shot-berries” or a cluster looking like a bunch of “hens and chicks.”
Normally we’d be fairly concerned about fruit-set and what clusters might look like. But with the uncertainties of COVID and an oversupply of bulk wine from previous vintages, we welcomed some natural crop thinning.
The additional May rain notched us up to 7.9 inches total for the rain season, compared with last year’s 21.3 inches and the 2016-2019 average of 20.4 inches, making for 39% of normal rainfall. Luckily the reservoirs still had healthy reserves from last year.
California, as a whole, did somewhat better:
Within a week of the rain, we were hit with a short heatwave, reaching 101.8 degrees F on May 27. That heat lifted the Growing Degree Days (GDD) above average.
Meanwhile, after having flattened the initial curve of COVID cases, on May 25 our Governor began allowing the reopening of selected business sectors. In early June, wineries were allowed limited indoor tasting. Unfortunately, citizens tired of being cooped up took the new sense of freedom and went against guidance to gather for family get-togethers over the Memorial Day weekend, then for Father’s Day. Case counts rose dramatically after the incubation delay, forcing the Governor to once again close bars, then indoor winery tasting on July 13. Lodi wineries rearranged operations and permits to more permanently serve customers outdoors.
In the fields, the vines were using the heat and enough water in the ground to send out longer shoots and laterals that had to be thinned. We spent quite a bit of time pulling fruit-zone leaves to open up the canopies to let in light and air to help with ripening and hinder powdery mildew.
Fruit set for all varieties looked good with normal sizing-up. Crop size was good, not over-cropped. Sulfur spraying was regular – every 10 days – and unexciting.
First sign of color in the skins was toward the end of June, on schedule. We dropped green fruit to balance the crop load where needed, not quite as much as usual.
Veraison finished up during the later part of July. Berry size was looking smaller than last year and we estimated crop size to be down about 10%. Light irrigation was applied during hotter days in July.
We noticed the first social media posts showing harvest on July 30, when LangeTwins Winery brought in Chardonnay from their River Ranch vineyard block. The pick was made at night and was presumably at low pH for sparkling wines. Harvest continued daily/nightly from that day on, mostly focused on grapes for sparkling wines.
And then came…
August
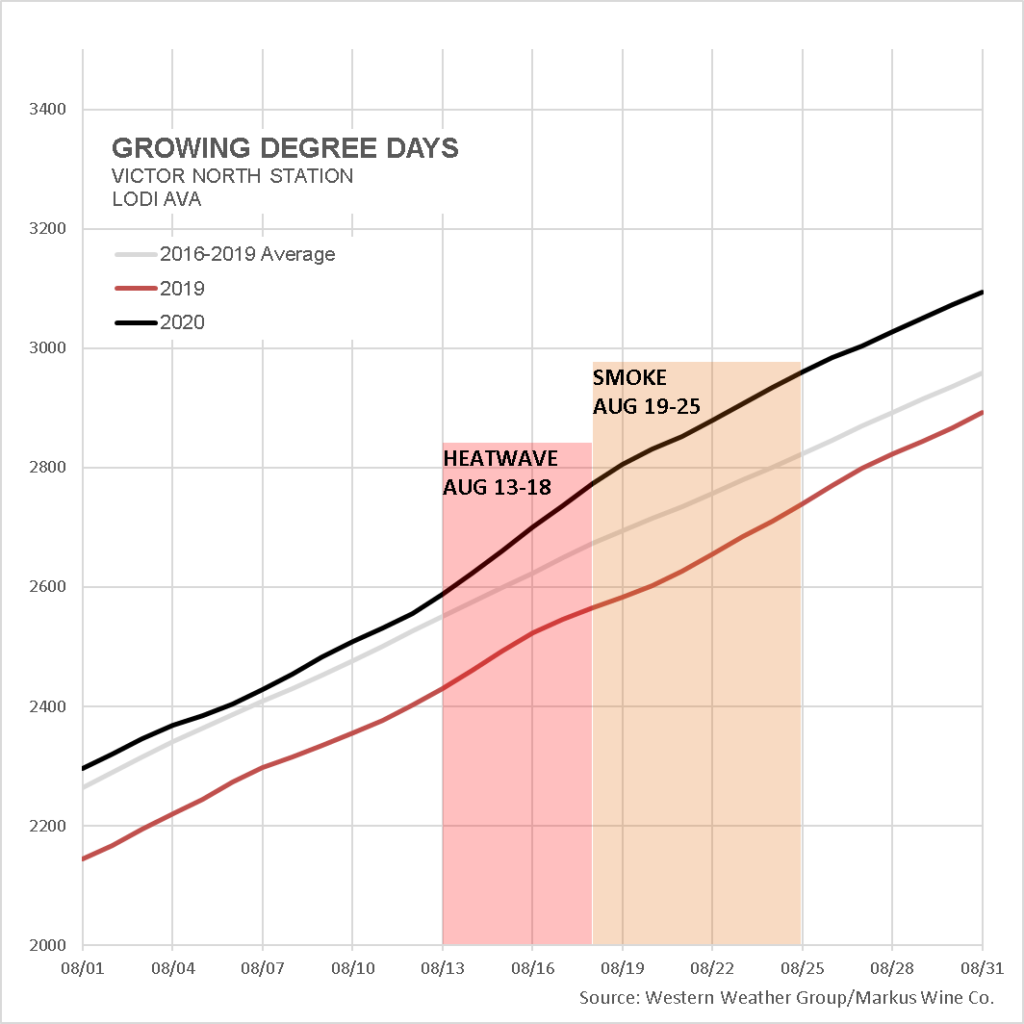
The first two weeks of the month were ideal – temperatures slightly below season averages, with clear, sunny days. The famous cooling Delta Breeze was helped by a low pressure system that repeatedly moved a bit inland then back out to sea. We were watching the GDD curve move down closer to the long-term average, most thankfully.
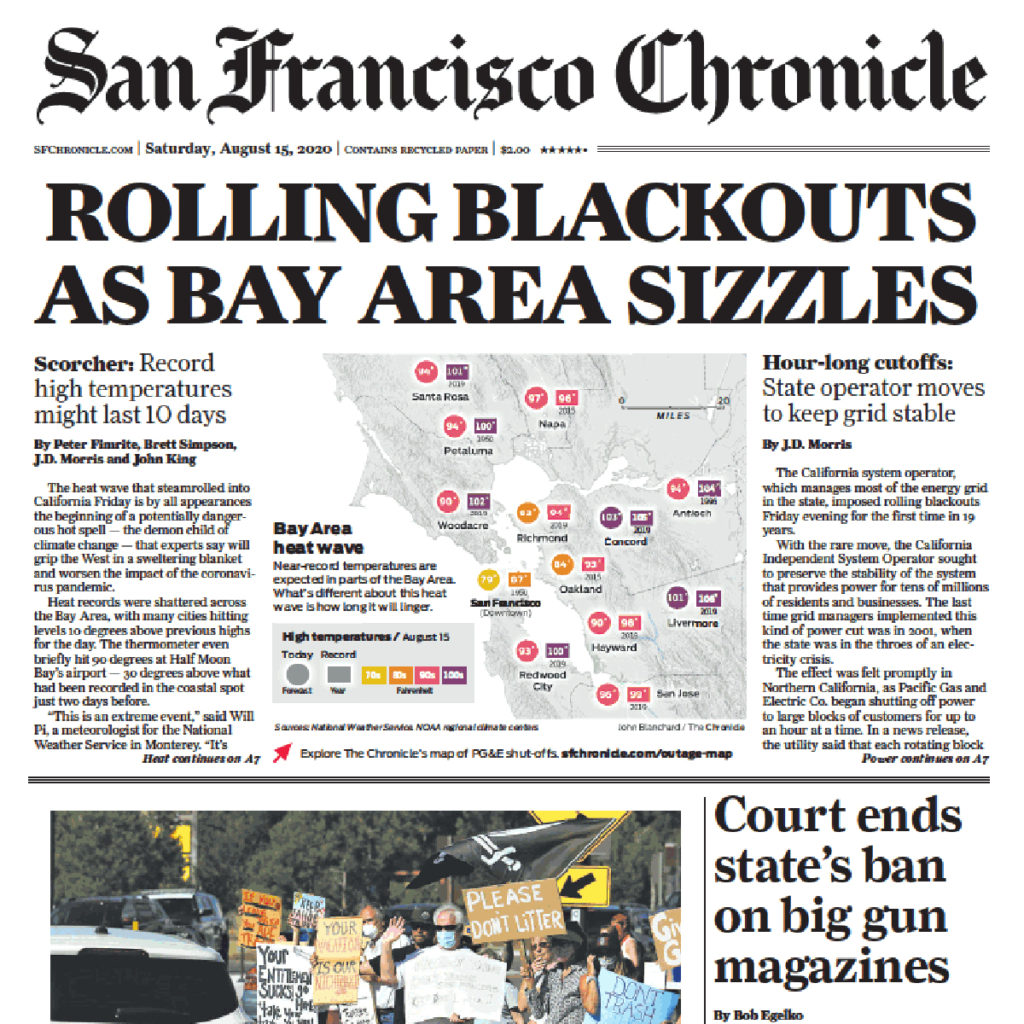
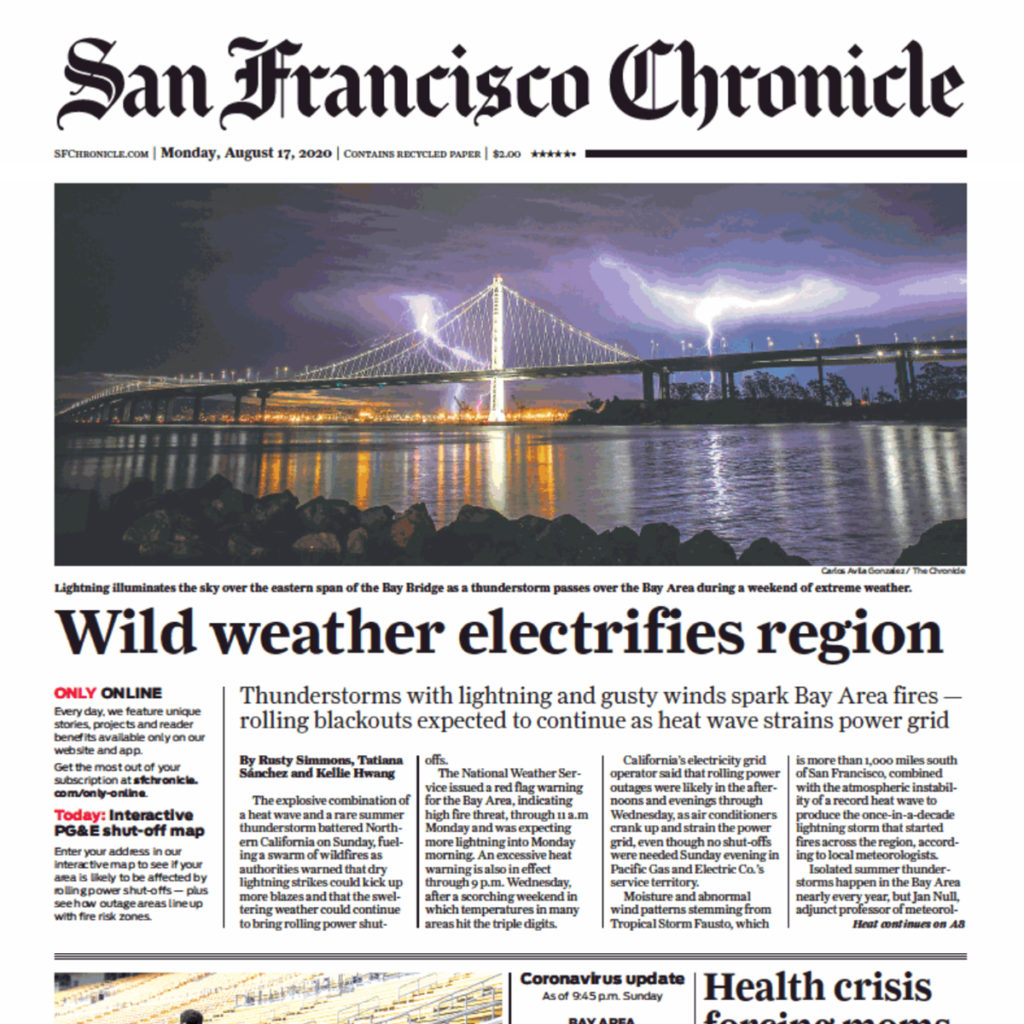
Then Thursday, August 13 arrived, bringing back triple-digit temperatures and the start of a record-breaking heatwave over most of California:
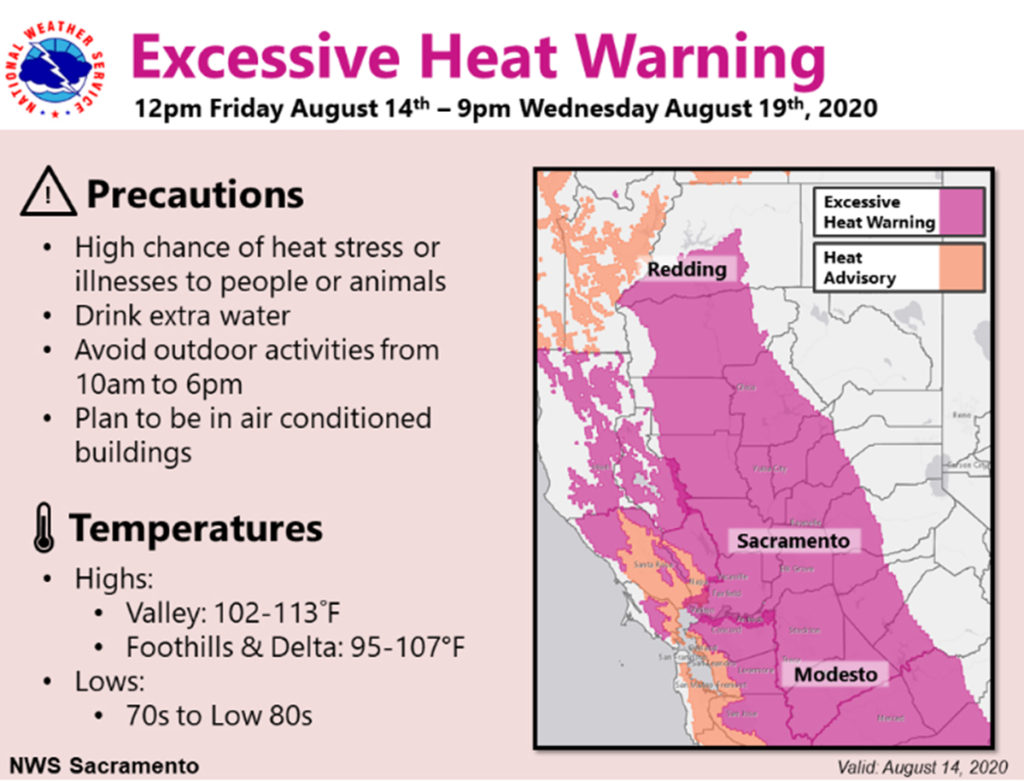
Here’s the forecast we were looking at, showing 5pm temperatures over 100 degrees F expected to last until nearly the end of the month:
This was to be 7-10 days in a row of over-100-degree heat brought by a high pressure ridge expanding northwestward from Arizona, pushing that low pressure system further off shore. Normally, we experience only two or three days of rising and falling heat before the Delta Breeze returns to bring us back down into average temperatures.
Knowing the heat was coming, many wineries brought in whites, such as Chardonnay, Sauvignon Blanc and Albariño, that were ready to pick – or at least close enough. (The alternative would be to water those vineyards back to prevent the fruit from desiccating.)
As predicted, we hit 103.8 degrees F on Friday, 105.0 on Saturday, and 109.5 – our highest for the year – on Sunday. Also on Sunday, Death Valley hit 130 which could be certified as the hottest reliably-measured temperature in world history. (Death Valley previously hit 134 on July 10, 1913, measured with less-sophisticated equipment.)
Over the weekend, as the hot high pressure system rotated clockwise, it drew the off-shore low northward:
Scattered mid- and upper-level cloudiness, remnants of eastern Pacific Hurricane Fausto, moved onshore following the coast up from the south, through Santa Cruz and continuing northeastward over the entire Bay Area. The combination of clouds and heat contributed to record high minimum temperatures in the 70s.
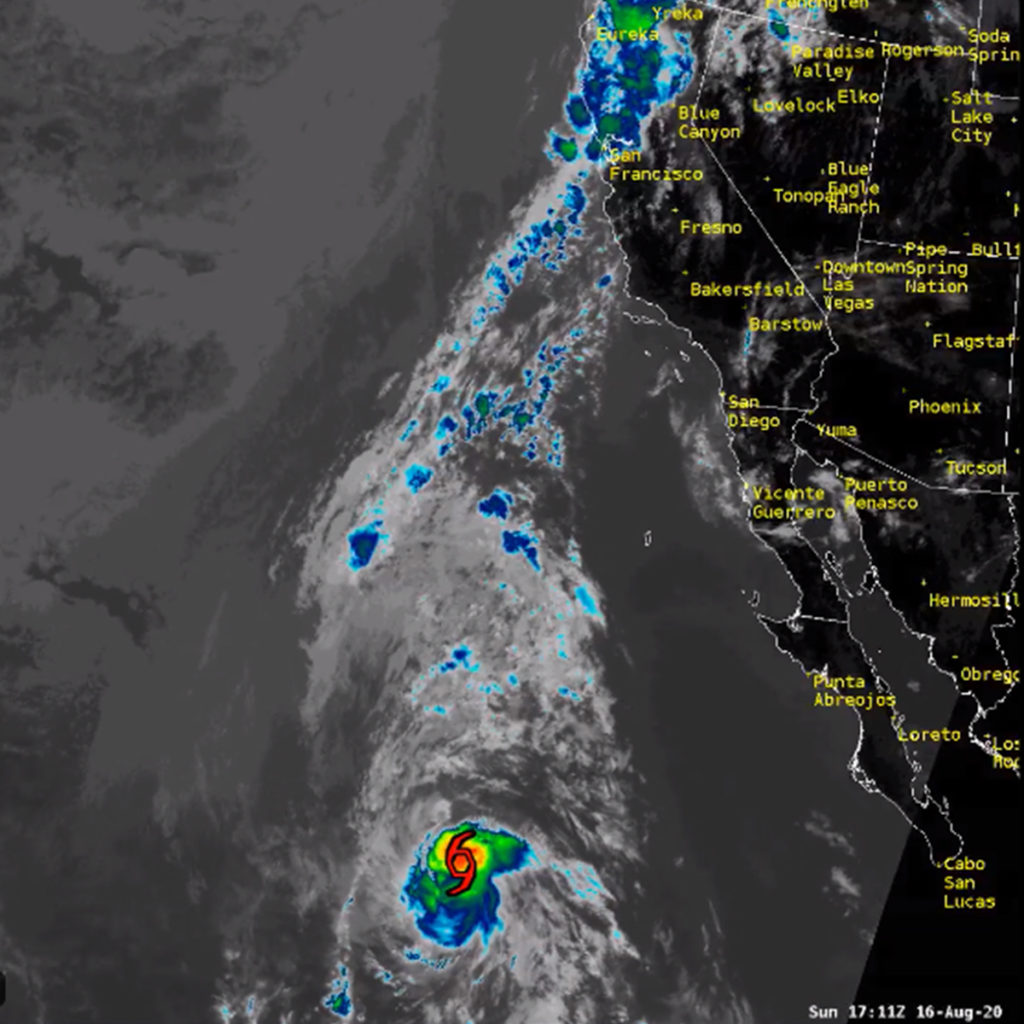
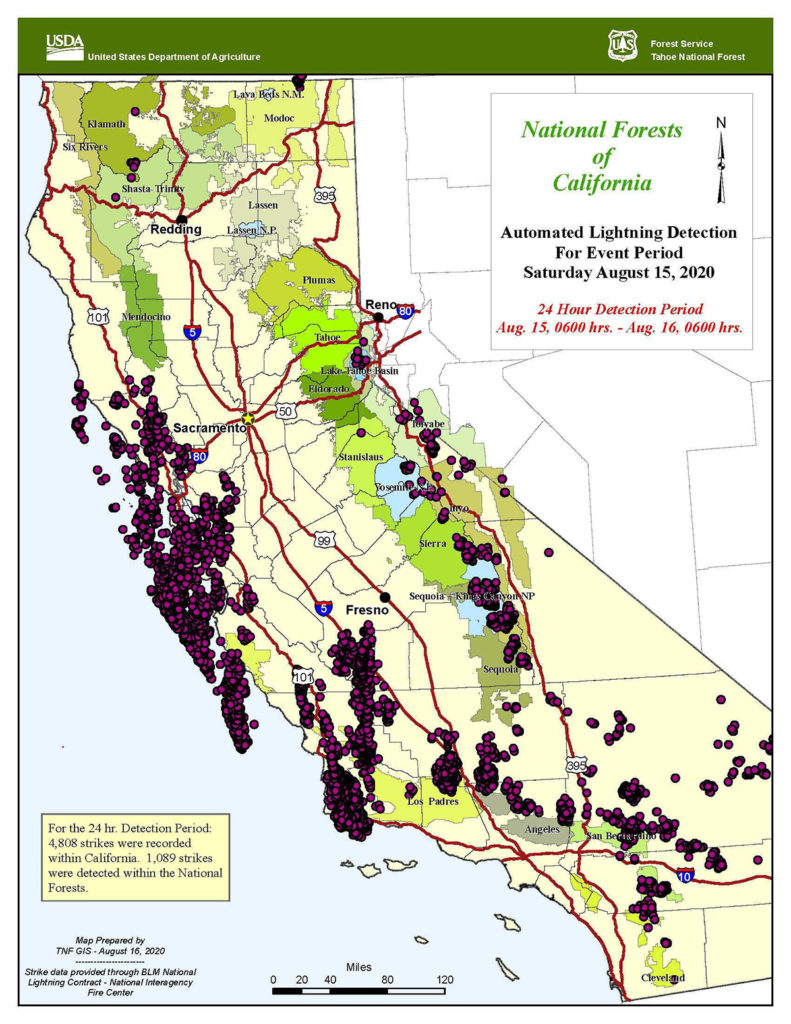
The tropical moisture from Fausto unfortunately spawned numerous thunderstorms producing 4,808 dry lightning strikes, most hitting from late Saturday night to Sunday morning, along with insignificant rain over the Bay Area and Paso Robles.
Throughout the morning, we could hear thunder coming from the Tracy area, southwest of us.
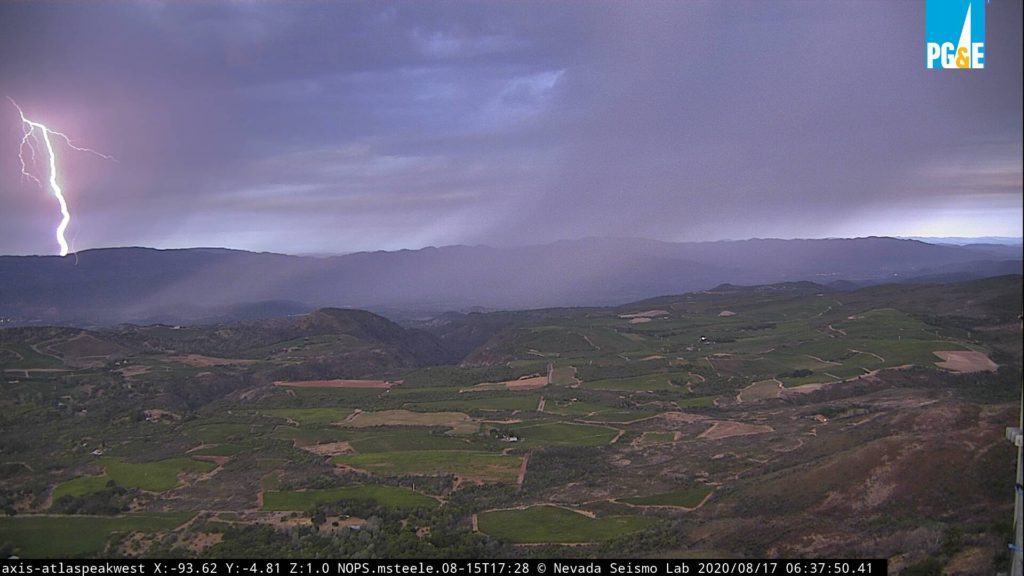
There was another round of thunderstorms and dry lightning on Monday morning that focused more on the North Bay, including Napa and Sonoma Counties:
Whatever grass or brush that wasn’t already dry from lack of winter rainfall was now completely dried and ready to ignite.
After 72 hours, California recorded a total of 10,849 lightning strikes and firefighters were battling 367 known fires on Wednesday, with 23 considered major “complex” fires – collections of blazes from several nearby lightning strikes.
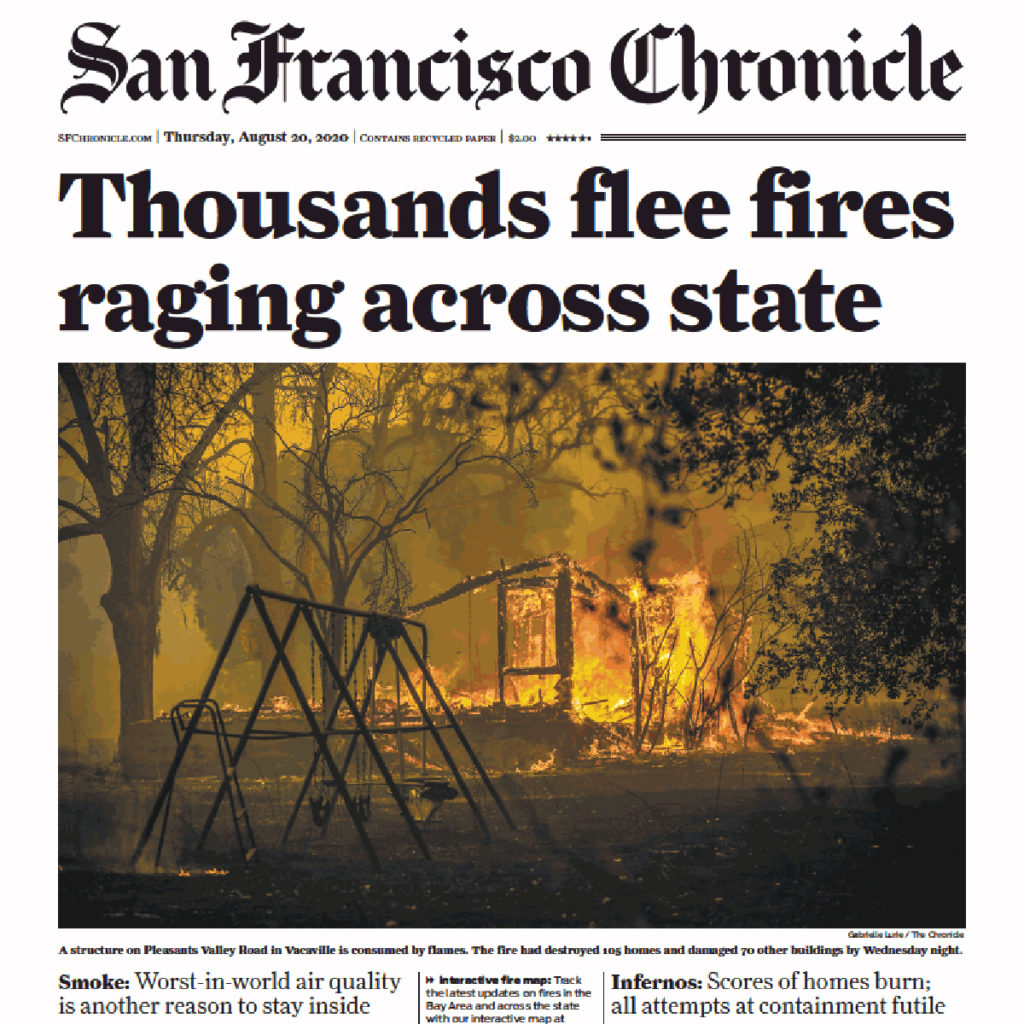
The biggest fires were named the SCU Lightning Complex, burning in the rugged mountainous region east of San Jose and south of Tracy, in Contra Costa, Alameda, Santa Clara, Stanislaus and San Joaquin counties; and the LNU Lightning Complex, burning mainly in Napa and Sonoma Counties. Both fire complexes were 100% contained on October 1.
The SCU Lightning Complex burned 396,624 acres (making it the third-largest wildfire in California history as of October 1) with 222 structures destroyed. Fortunately, firefighters were able to preserve the historic Lick Observatory on Mount Hamilton. The LNU Lightning Complex burned 363,220 acres (fourth-largest in history) with 1,491 structures destroyed and 5 deaths.
Here in Lodi, we noticed the first significant smoke from the fires on the morning of Wednesday, August 19. The smoke became thick enough to obscure the daytime sun into a pinkish-orange circle you could stare at, generating an odd sepia tone. Temperatures were depressed about 7 degrees below forecast. A layer of ash deposited on vines and our cars throughout the day.
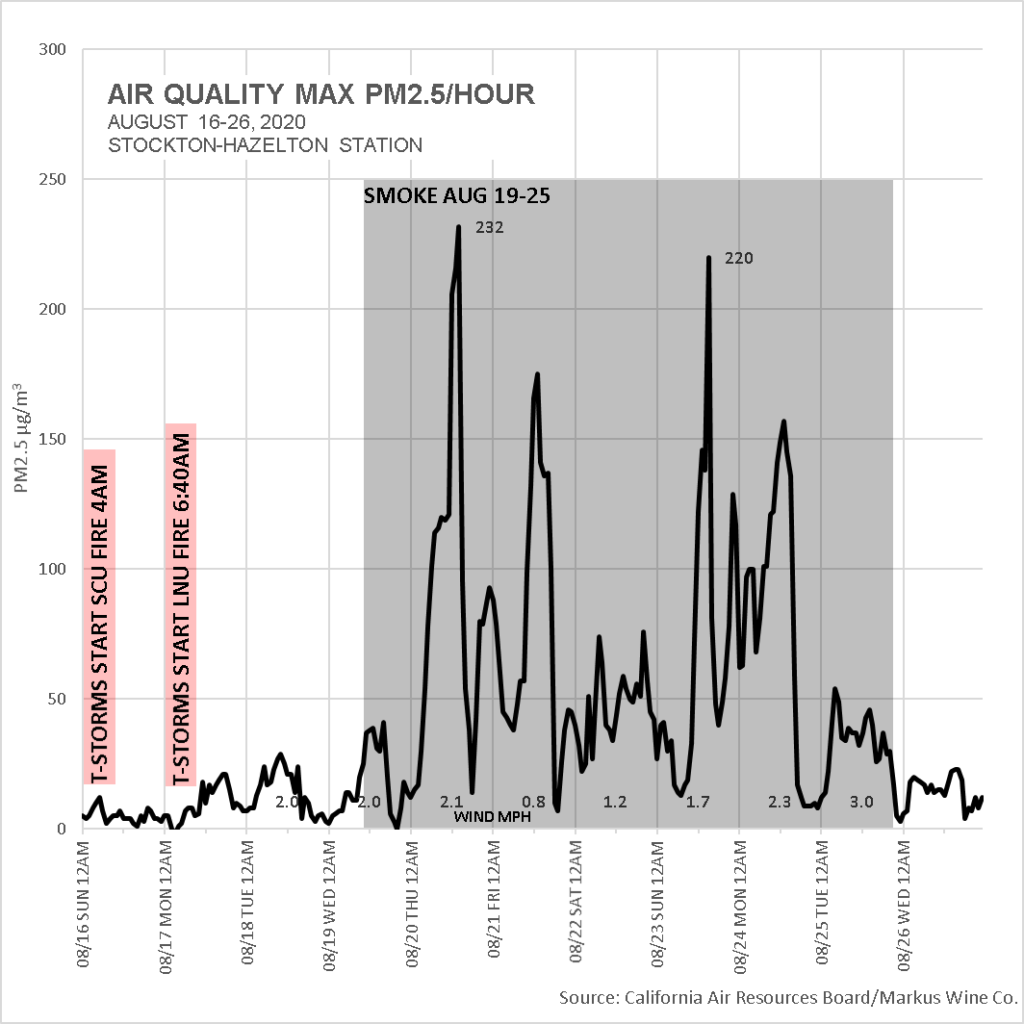
Our daily log, August 22-26:
By Saturday, before sunrise, skies cleared enough so we could see Venus and Mars, but no stars. There was much more regular sunshine with little sepia tint that night.
Pre-dawn on Sunday, we could now also see Orion in the eastern sky and Cygnus to the west. There was little smell of smoke, and when the sun rose, we couldn’t look at it. Pretty much back to near-normal skies that morning. But not for long.
Smoke levels were higher Monday morning. Pre-dawn, we could see Venus and Mars, but no stars. The sun was once again an orange-pink disc.
Smoke levels were a bit lower Tuesday morning. Pre-dawn, we could see Venus, Mars, and Orion, but only barely. When the sun rose, we thankfully couldn’t look at it.
Smoke levels were even lower Wednesday morning and the sky finally cleared to a nice blue as the day progressed. Cooler weather and a more extensive marine layer from an off-shore low pressure system helped greatly with firefighting efforts overnight.
You can see from the experimental smoke forecast simulation below how the marine layer cleared smoke from the coast and also pushed our famous cooling Delta Breeze through the Sacramento River Delta and into the north and south portions of the Central Valley:
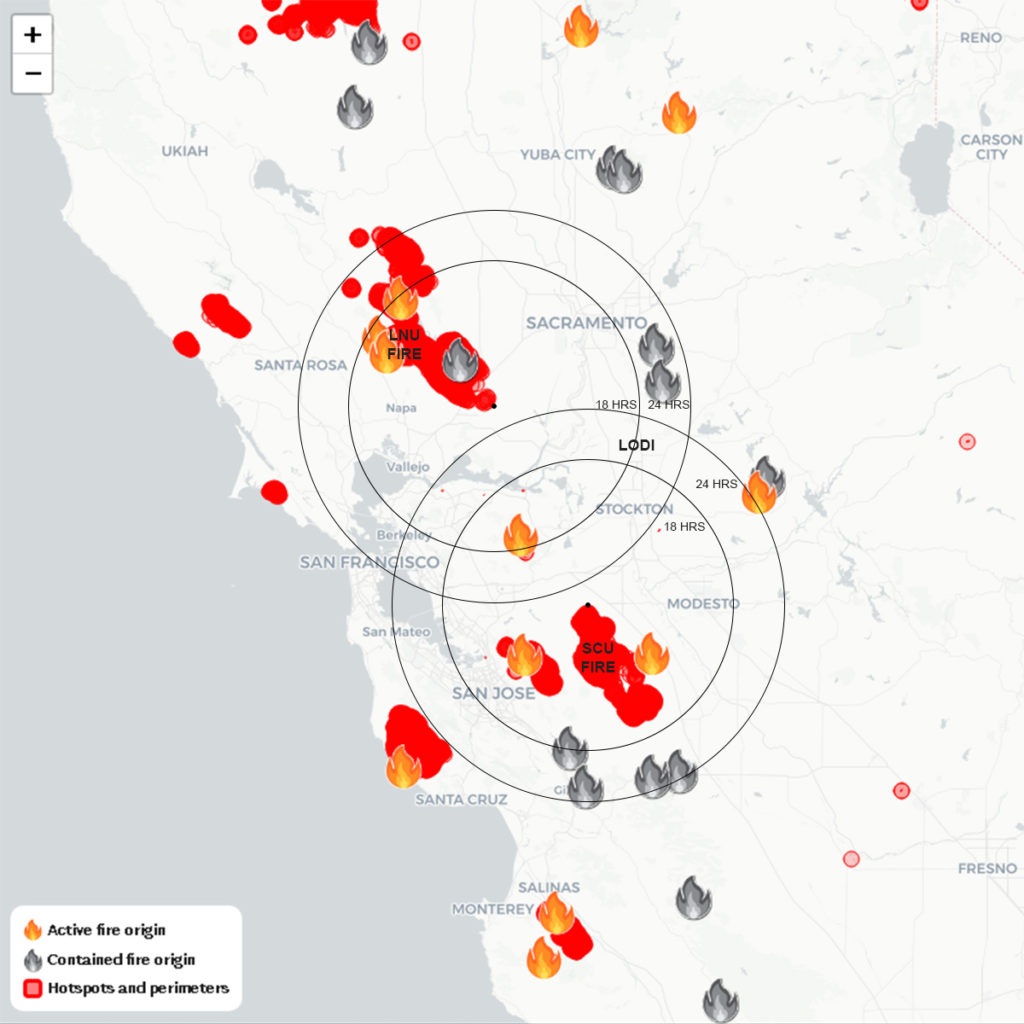
Winds at the Victor Station during Wednesday through the following Tuesday were light, averaging 1.9 mph. The winds shifted during this time period, but the prevailing direction of the winds were toward the southeast, as shown below:
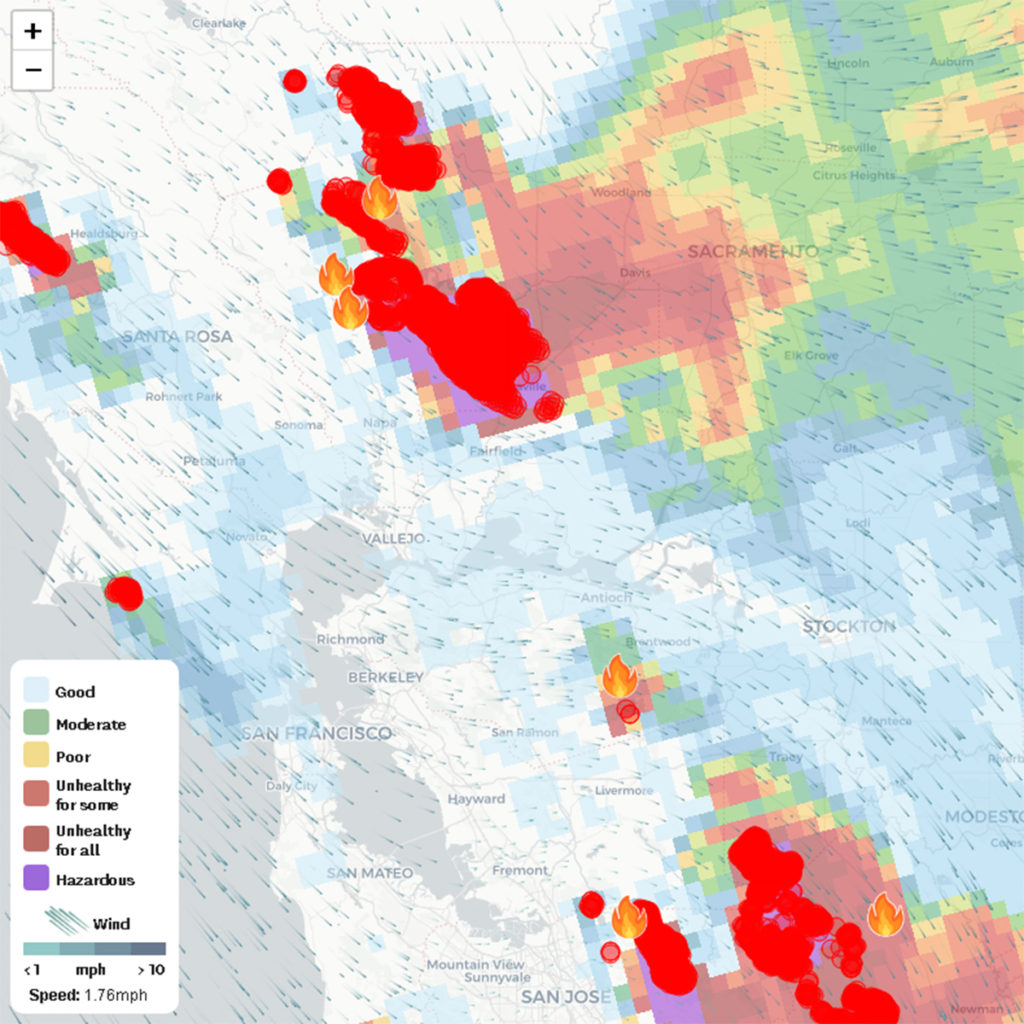
At its closest approach to Lodi on Wednesday, the SCU fire was about 39 miles southwest of us. The LNU got to about 45 miles northwest of Lodi when it destroyed homes along western Vacaville.
Using the 1.9 mph average wind speed to plot 18- and 24-hour travel times on the fire map (further above) we can see that the prevailing winds from the LNU fire would have reached the western side of the Lodi area in about 17 hours or even longer.
This time frame is important because the current research into smoke taint (scroll down to see details) indicates that the taint-causing volatile phenols are dissipated almost completely in smoke older than 24 hours. Bear in mind that there has been very little research to date into smoke and atmospheric conditions.
While it is possible that some winegrapes in Lodi could be subject to smoke taint, considering the age of the smoke, and that the wind was not blowing from the northwest fire during the entire time frame, we surmise that smoke taint will be unlikely.
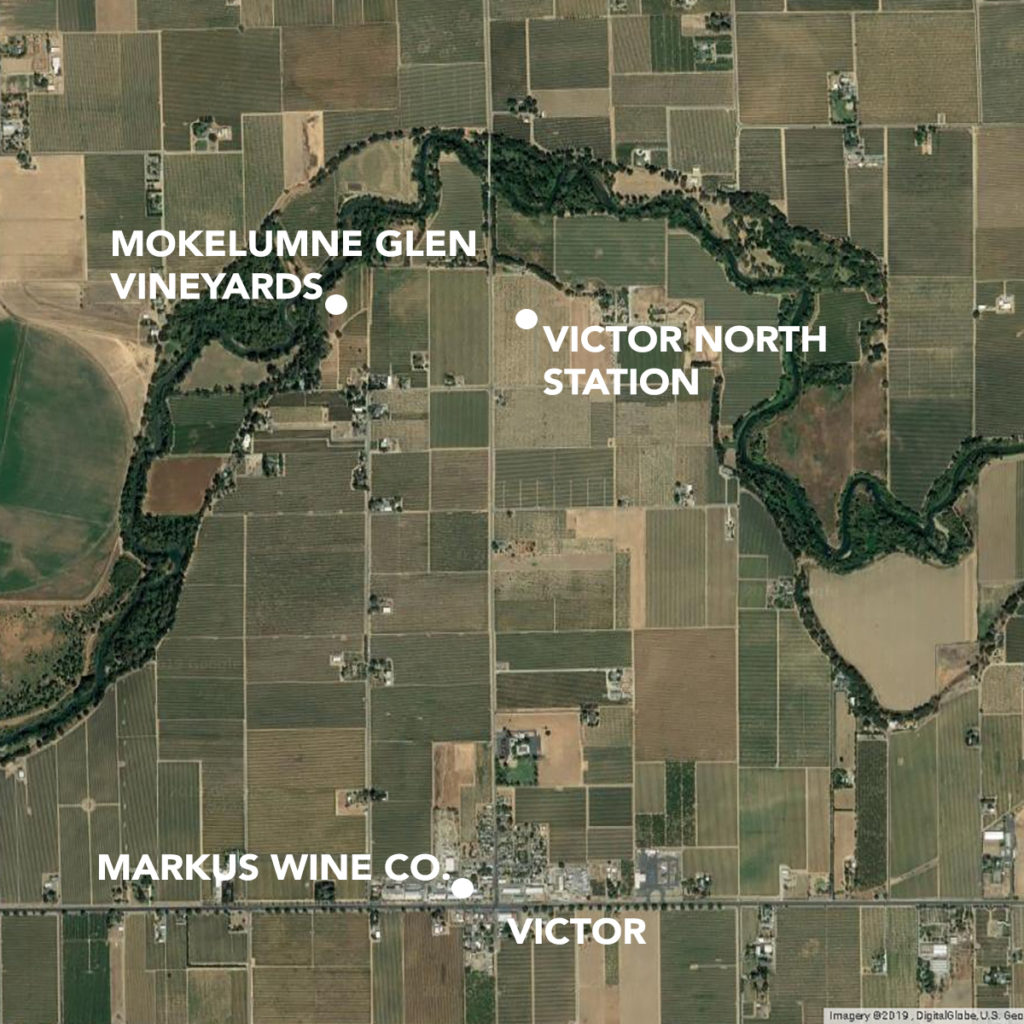
Harvest continued all during August, despite the smoke. We picked our flagship white winegrape Kerner from Mokelumne Glen Vineyards, just west of Victor Station, on Tuesday, August 25:
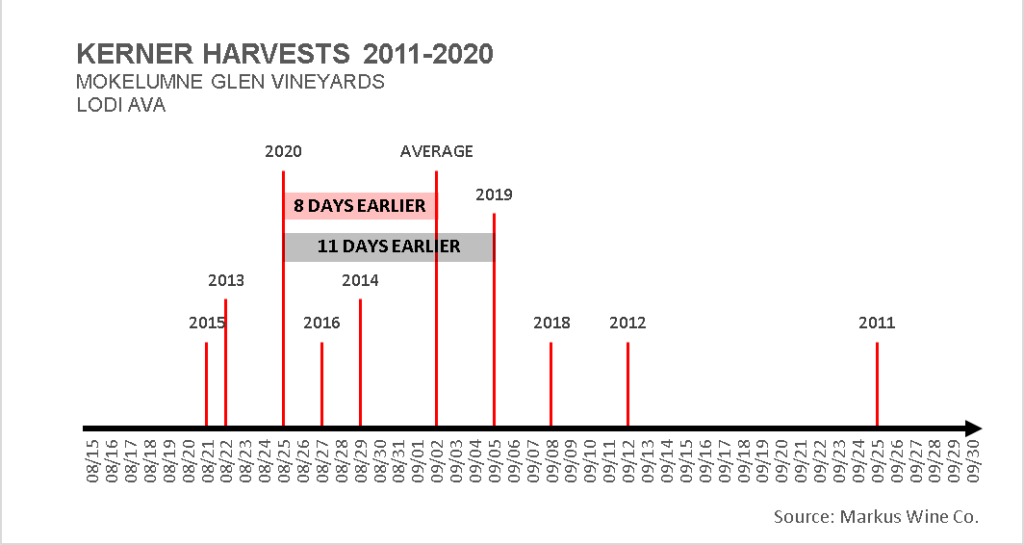
This date was 11 days earlier than last year and 8 days earlier than our 2011-2020 average.
For grapes still on the vine, the heat changed grape chemistry, such that it is hard to predict the remainder of harvest timing. But even before harvest, the overall higher GDD accumulation and observations from the field of a projected lighter crop had us all expecting that harvest would be earlier than average.
It is interesting to look at how the diurnal variation might have changed during the heatwave:
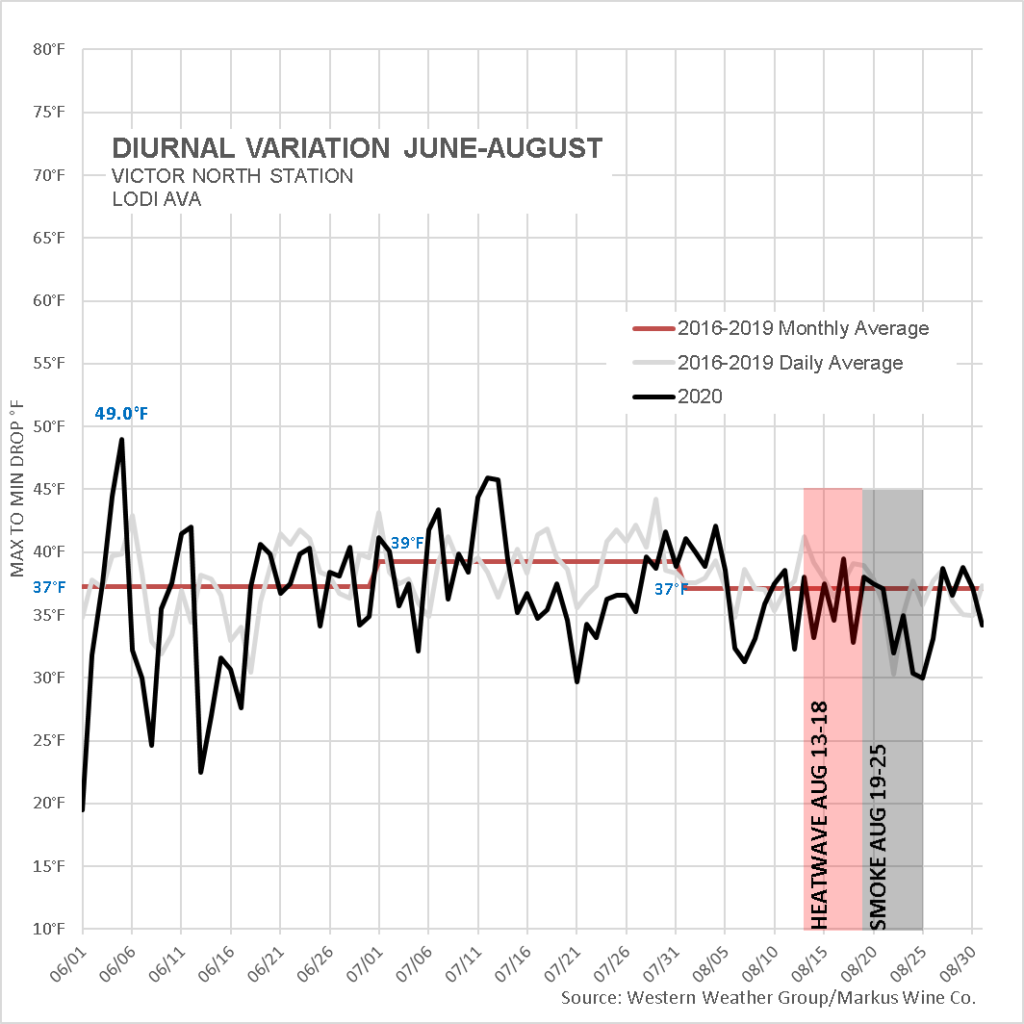
During August, our diurnal variation over the 2016 through 2019 vintages averaged a drop of 37 degrees F off of the maximum of the previous day. This year, most of August had drops of a little less than average. It is hard to say if this was due to the heatwave and smoke, or if other factors contributed to the change.
This month turned out to be the hottest August on record in California history, with records going back to 1895.
September
We had some amount of light smoke most days during the first week of the month.
Harvest crews were very busy, but available. Some modifications have been made to protect against COVID. Otherwise, we have yet to see serious impacts of the virus on operations in the field or the winery. By the beginning of the month, San Joaquin County had over 18,000 cases and 368 deaths recorded and was rated in the highest “widespread” tier in California’s status for risk.
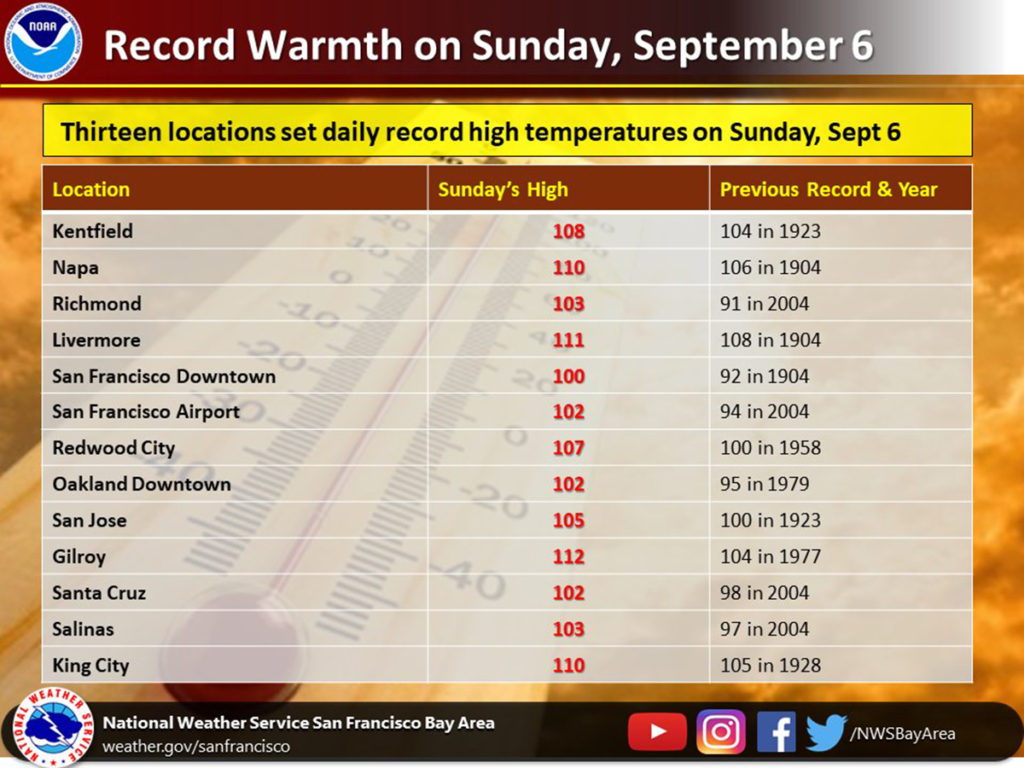
Another record-breaking heatwave for California arrived over Labor Day weekend, starting on Saturday, September 5 with 101.3 and 106.3 at Victor on Sunday, while the nearby normally cool Bay Area actually suffered even warmer temperatures than us:
The heat was followed on Monday night into Tuesday by high winds:
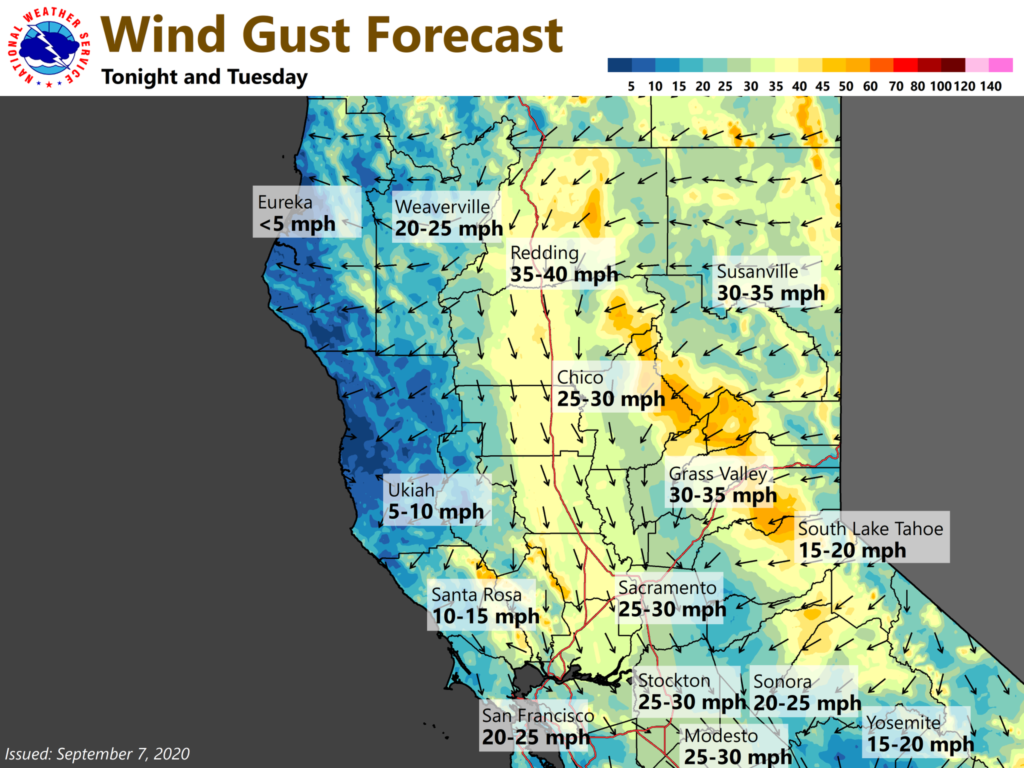
The winds caused many of the fires that were still burning to grow in size. The North Complex Fire (including the Bear Fire), east of Lake Oroville, southeast of Paradise, grew incredibly rapidly within 24 hours.
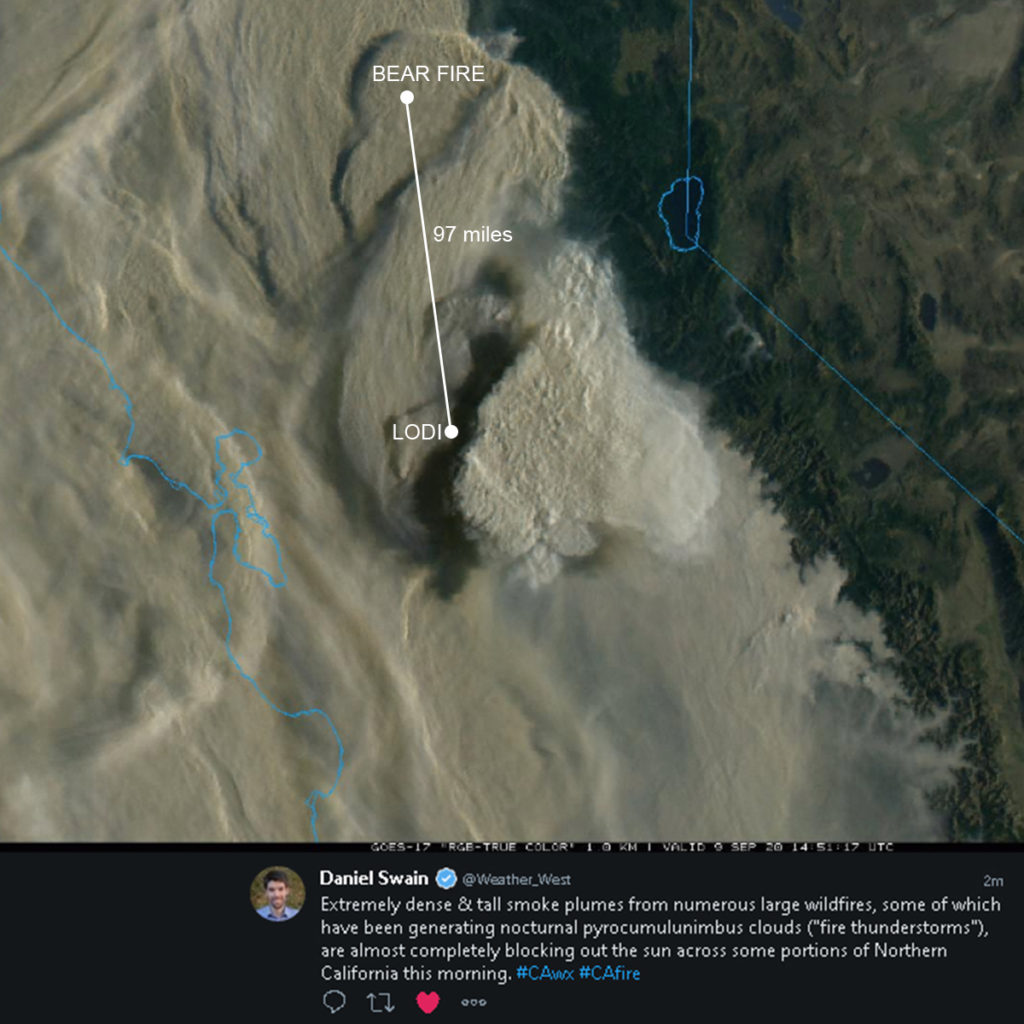
This high-altitude smoke slowly covered our region starting Tuesday morning, bringing back the sepia tone and lowering temperatures 5 degrees below forecast that day and 12 degrees on Wednesday.
Because the smoke had traveled 97 miles and was so high in the air, we were once again not concerned about possible smoke taint.
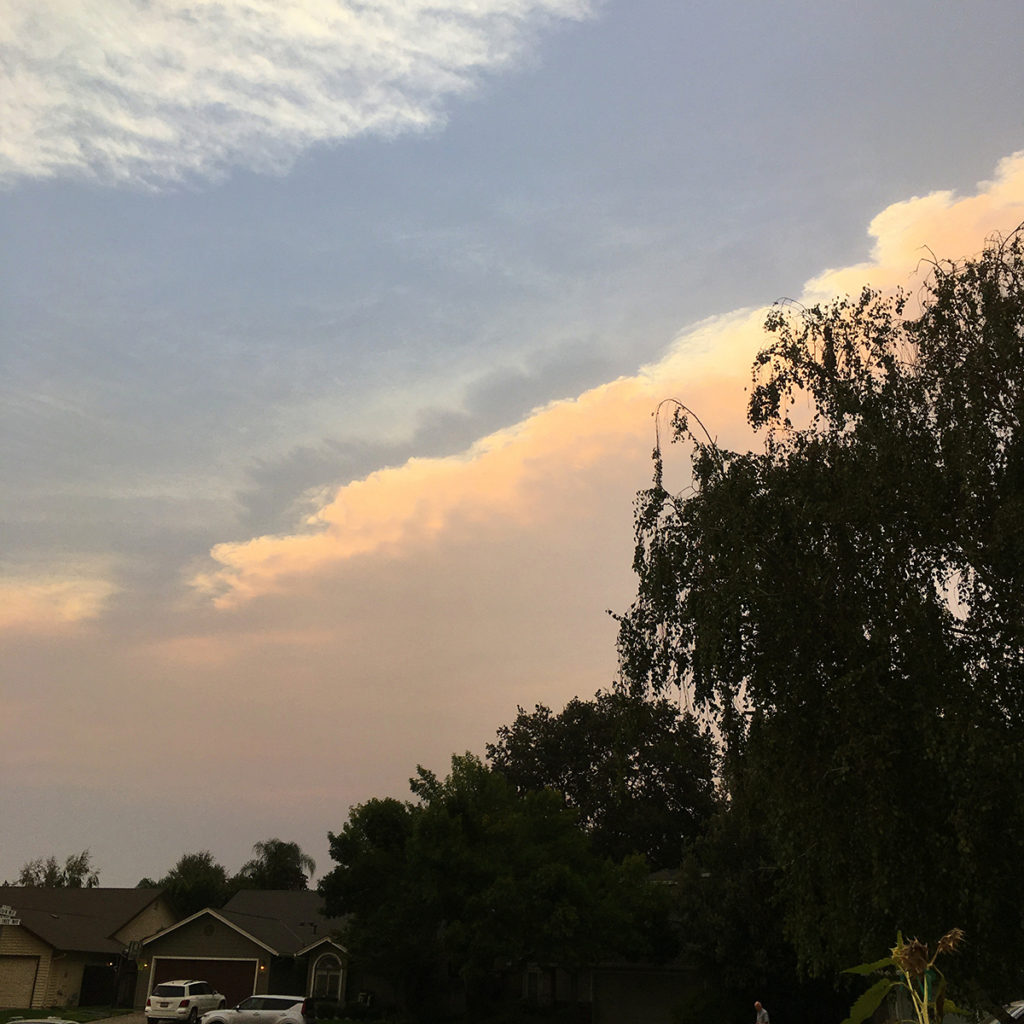
West of us, the smoke layer moved above the incoming marine layer of fog over the Bay Area, darkening the sky and blocking all blue light, creating what some referred to as the pumpkin-spice-latte apocalypse:

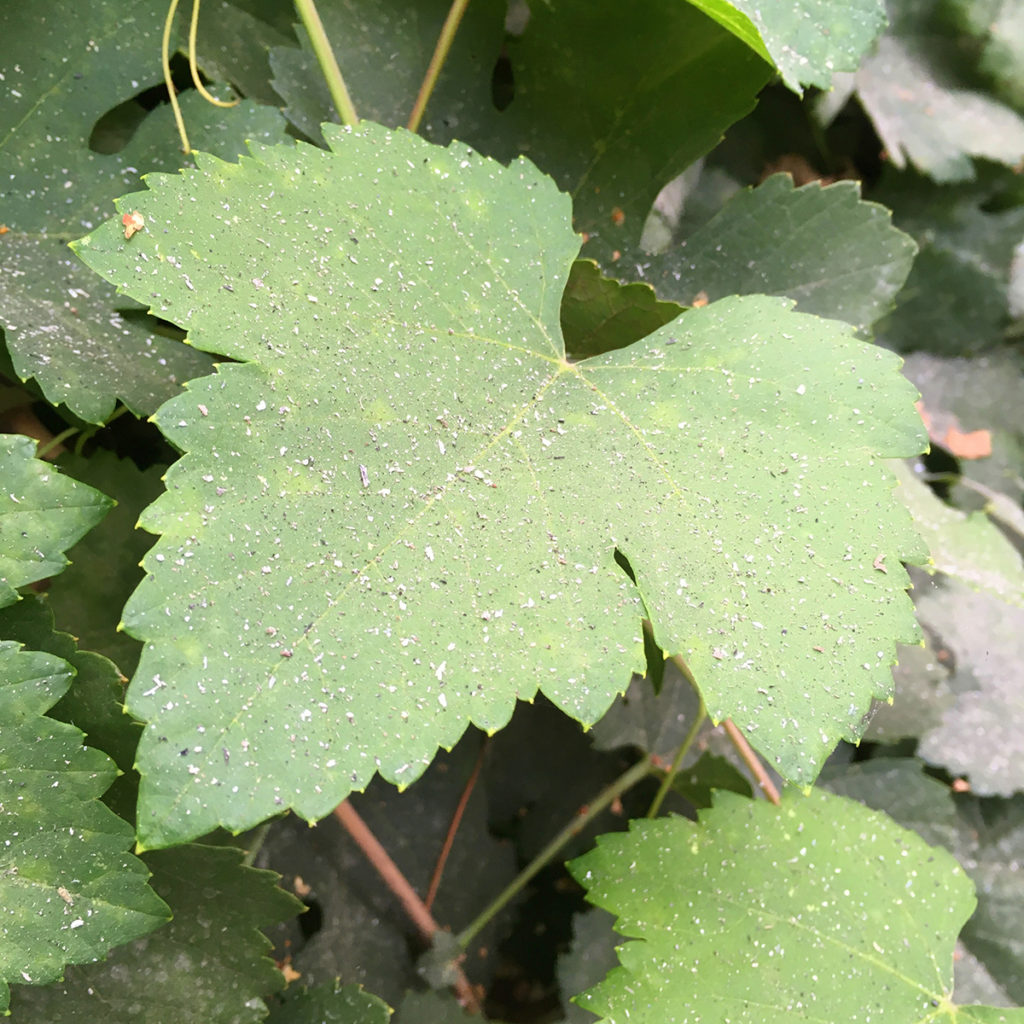
The heavier particles of ash settled over our region:
After a few weeks of sampling the early reds, such as Zinfandel, Merlot and Syrah, we noticed that readings of sugar levels (Brix) were showing little change. At the same time, pH was increasing, indicating the drop in acids. We know that heat in the upper-90s or above usually slows down ripening, as vine leaves close stomata to retain moisture. We would expect the vines to completely shut down, but the movement in pH indicates the vines are still metabolizing somehow. We also do not have much guidance as to what affect there could be from lowering of sun UV rays by the smoke.
To give you an idea of the uncertainty we were facing regarding making picking decisions, here is the forecast discussion for Friday morning, September 11 at 5:53 am:
An upper ridge of high pressure along the West Coast is forecast to weaken slightly while migrating slowly inland across California today & tomorrow. If conditions were normal we’d see sunny skies & temps in the middle 90s today & trending toward upper 90s tomorrow. However, it’s anything but normal with smoke from local wildfires blanketing much of the state reducing solar insolation causing temps to end up much cooler than the model guidance suggests. Although the smoke is thinning some it should remain dense enough both today & tomorrow to keep daily max temps about 10 degrees below forecast guidance. After tomorrow there’s too much uncertainty to consider adjusting temps as it all depends on fire activity, how much smoke is being produced, and how well the winds (near the surface & aloft) are able to carry the smoke away. Winds will remain relatively light today, pick up a little tomorrow before increasing noticeably (out of the SW-W) on Sunday.
Marc Walsh, Meteorologist, Western Weather Group
On Monday, September 14, an off-shore low pressure system brought back the Delta Breeze and skies cleared noticeably of the smoke. Previously, due to a lack of sufficient wind, the smoke had been accumulating in the Central Valley from many distant fires, continuing to depress daytime temperatures.
Though we had many days of light haze from smoke, by Tuesday morning, September 22, clear blue skies finally returned.
Gordon Burns of ETS Labs was quoted as saying early results show that a significant portion of the samples of wine and grapes that are coming through are not showing guaiacol and 4-methylguaiacol – the markers of smoke impact. We heard from a few Lodi wineries that received test results on smoke taint precursors that they did find low levels in some grape lots from some Lodi vineyards. However, everyone said they can’t taste or smell any taint. It is possible that taint could emerge up to 9 months from fermentation, so it is still early to know for sure. Also, ETS is currently working through a backlog of testing that has kept their lead time several weeks out. One fellow winemaker sent his grapes up to Canada for testing to get results faster.
On Sunday morning, September 27, the Glass Fire started burning near St. Helena in Napa Valley, then quickly spread in all directions, tragically damaging several wineries.
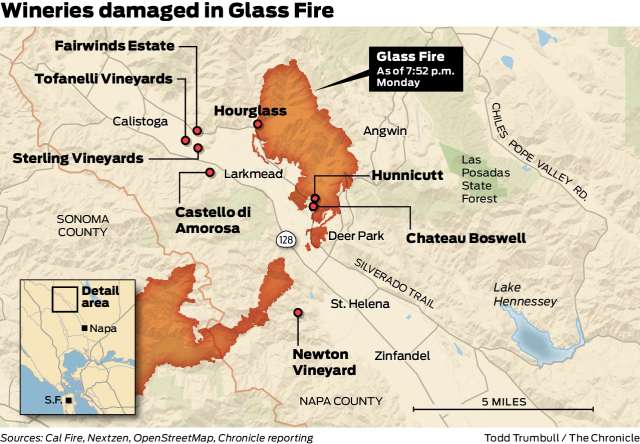
We are holding all of Napa and Sonoma in our prayers.
The only sort of good news is that all the smoke from the major Northern California fires was going out to sea.
On Tuesday morning, September 29, a light haze of high-altitude smoke returned over Lodi, having traveled from many distant fires, carried by shifting winds.
Like August, this ended up being the hottest September ever in California.
October
Smoke from the many Northern California fires was a little more noticeable on Thursday morning, October 1. Pre-dawn, we could see the full moon with a light sepia shade, along with Mars, Venus, Sirius but no other stars. The smoke shaved about 3 degrees off the forecast high. It wasn’t until Sunday that the stars were back on display followed by mostly blue skies and only a slight smell of smoke in the air.
We finished picking Cabernet Sauvignon on October 8, and other Lodi wineries are finishing up with this variety – usually one of the last of harvest – that week.
From the October 2020 Ciatti Global Market Report:
As across the state, yield in the Central Valley is
estimated to have come in 10-20% lighter than the
average. The Valley’s crop potential has looked lighter
throughout the growing season and this lighter estimate
does not include the impact of smoke exposure because
it has been much less of a concern in this region –
and in the southern Valley in particular – than on the
Coast. The Valley has seen very few rejections of grapes
because of smoke exposure concerns.
Like August and September, this ended up being the hottest October ever in California. October was also completely dry, whereas we normally get our first storm in the first half of the month.
Looking Ahead (at least trying to)…
It felt like we snapped straight from summer to winter when the nice, mild temperatures abruptly dropped from a high of 81.8 degrees F on November 5 to 64.1 the next day, followed by a few frosty nights. Then on November 13, we received our first 7/10″ of rain of the season, accumulating about a quarter of an inch by the 18th from a series of storms that helped the northwest and Sierras more than our area. (An EF1 tornado touched down around 2pm on the 18th between Oroville and Concow and did some minor damage.)
The forecast for the remainder of November may have a little more rain, but the long-range models point to a drier than average winter.
We’ll come back later to provide an update on the quality of the fruit, plus crop sizes in February when the Crush Report is released.
In any case, we’re hoping for the best fruit possible for us and for all of you!
Smoke Taint Research
We, and over 600 industry and press members, attended a “Wildfire & Smoke Exposure Events” web presentation by California Association of Winegrape Growers, featuring Anita Oberholster, Ph.D. of UC Davis and others on August 26, 2020.
As background, Australia has led research into smoke taint, drawing on their unfortunate recurring and damaging wildfires. The website of the Australian Wine Research Institute has a page devoted to Smoke Taint with this summary that agrees with Dr. Oberholster:
“The compounds in smoke primarily responsible for smoke taint are the free volatile phenols that are produced when wood lignin is burnt. These can be absorbed directly by grapes and can bind to grape sugars to give glycosides that have no smoky aroma. Often these glycosides are described as smoke taint precursors. During fermentation (and also over time in barrel or bottle) these glycosides can break apart, releasing the volatile phenols into the must or wine, and allowing the smoky flavour to be perceived. These glycosides can also release the volatile phenols in the mouth during the drinking of wine, which may contribute to the perception of smoke taint.”
Australian Wine Research Institute
The smokiness can be tasted in the back of the throat. And since enzymes in the mouth can release bound phenols, sensory analysis can give you a faster impression of relative taint if you’ve been trained, though it is no substitute in court for lab results.
White and red grape varieties probably absorb volatile phenols from smoke at about the same level into berry skins. Since white wines tend to be pressed off the skins sooner than red wines, whites will likely have lower levels of volatile phenols in the fermented wine. However, since whites are often less extracted and complex on the palate then reds, the volatile phenols may be more easily perceived by consumers in whites. Bound volatile phenols extract during winemaking similar to how color anthocyanins extract. If you see color emerging, any volatile phenols will be, too.
In the final wine, fruit masks the perception of taint, whereas pyrazines (as in bell pepper) enhance perception of taint. Taint is usually less noticeable in a wine that has a higher alcohol level, higher sugars, higher phenols, or lower pH, due to the way enzymes in the mouth act on the wine. Aging wine in oak increases phenols and makes testing for taint unreliable. Also, phenols shift from bound to free during aging. If wine is bottled within 3-6 months of harvest, it is possible that undetected bound volatile phenols may become unbound and free later in the bottle, and therefore apparent as a fault to the consumer. Some wines only start to show taint 9 months after fermentation.
There is no research yet on whether or not volatile phenols can contaminate barrels and taint future vintages of wines put into those barrels.
In the vineyard, fresh smoke that was produced in the preceding 24 hours is most risky as a taint source. Presumably this is because the airborne volatile phenols dissipate over time. Density of smoke (i.e., AQI or PM2.5 measurement) does not indicate or correlate to the concentration of phenols. The density of smoke mainly indicates where smoke traveled. Also, the type of trees or vegetation burning changes the mix of phenols, but taint-causing phenols will still be present.
To illustrate the importance of the freshness of the smoke, Dr. Oberholster described research from a particular wildfire in Australia’s McLaren Vale. She said smoke from the fire completely bypassed a vineyard and moved out to sea. Winds later carried the smoke back from the sea where it collected in that vineyard, to the great concern of the grower. After testing, no smoke taint was found. The volatile phenols had dissipated.
There has been no definitive research to date correlating smoke taint to proximity to a fire, mostly because a large number of factors influence the movement and concentration of the volatile phenols. Wind direction, air pressure, the temperature of the fire, and how thick the column of smoke is over a particular vineyard are all factors. UC Davis, Oregon State University and Washington State University have together applied for a grant to establish links between atmospheric and geographic data to lab results. They hope to receive funding by the end of this year.
Dr. Oberholster suggested that there was not much that could be done to mitigate smoke taint once smoke had entered a vineyard. Preliminary testing shows there may be possible lessening of potential bound phenols if grapes were washed with water very soon after the appearance of smoke.
Greg Merrill and Kristine Fox of Pan American Insurance Services said that a grower concerned about possible smoke taint must take a sample of 300 fresh berries prior to harvest and have it analyzed for smoke (guaiacol and 4-methylguaiacol) through a third-party lab (such as ETS). There is no way to accurately taste for volatile phenols in grapes on the vine, partly because a person’s retro-nasal passage will already be exposed to lingering confounding ash or smoke in the air. The date and time collected along with the vineyard block must be noted, and the entire succeeding chain of custody and testing procedures must be recorded. The grower must file a notice of potential damage within 72 hours of when the smoke was in the vineyard.
Prior to the main pick date for a vineyard, a 300-berry sample may be collected and fermented to free up any bound phenols for sensory and lab analysis. Dr. Oberholster said these small-lot fermentations give a good indicator of what lab results will show from a later larger batch.
Dr. Oberholster suggested in a follow-up Q&A on September 15 that samples of berries or juice could be put into plastic bags or containers and frozen for lab analysis later.
If a winery wants to reject grapes for smoke taint, they must refer to the existing winegrape contract with the grower, if any. The winery must provide the grower with a written explanation of refusal of grapes.
Dale Stern of Downey Brand, LLP said, “This is an unplowed field. This is a relatively new event and we’re still learning as we go. There are no court precedents.” Growers should ask well in advance of harvest what level of volatile phenols will be acceptable. “Dr. Oberholster and her team are leading the way, but we don’t have any results that show what level should be acceptable.”
More information from U.C. Davis Viticulture & Enology Department:
Wildfire Impact on CA Grapes and Wine
Wildfire and Smoke Exposure Resources
And if you’d like to know what wineries can do to help lessen the impact of fires and climate change, read this Tablas Creek Vineyard blog post by Jason Haas:
2020: The Year Climate Change Got Real for American Wine
About Victor North Station
The Victor North weather station is located within Katushas’ Vineyard, planted in 1915 and owned by Bedrock Wine Co.
The station is a third of a mile from the source of most of our white wines, Mokelumne Glen Vineyards, and just over a mile north of our winery in the hamlet of Victor, California. Victor is about 3 miles due east of the City of Lodi.
Data is automatically uploaded daily via the Western Weather Group and sponsored by the Lodi Winegrape Commission.
For Wineries
We purposely make extra wine and bottle it as shiners. We offer the wine for sale most of the year. We also source and sell Lodi winegrapes.
Please check out what we have to offer:
BULK & SHINERS GRAPESPast Reports
Thanks for reading!